Statistics Tab of the Business Account
Let's see how to use the Statistics section in your Business Account.
Our Statistics section allows you to view your statistics for any time period in the calendar or even for all time. The statistics filter also includes statistics on your 6 top-performing listings. For timeline charts, you can aggregate data by day, week, or month.
Note! Now if sellers have access to several accounts they can see the statistics for all listings of all their accounts on their dashboard. So the numbers on the dashboard might increase for some users. In other words, Seller Admins will see the statistics for all offices they have admin access to and agents will see the stats for all listings assigned to them.
Next to the time range selector, there is a button that allows you to export your statistics report as CSV. It can take several minutes to load, so, after clicking the button - please be patient and the download will begin shortly thereafter.

Several views are available in the dashboard: Overview, Lead Value, Detailed Metrics, and Top Performing Listings. Below, we will take a look at each category separately.
Overview
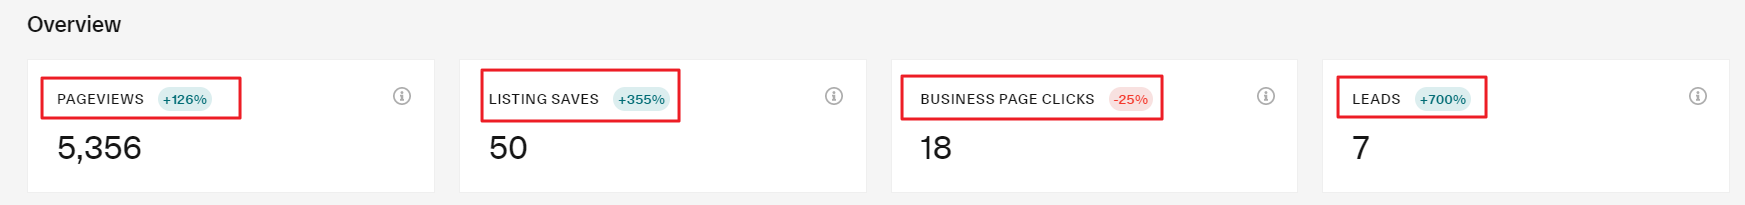
This is a snapshot of your performance for the time period that you selected earlier.
In the Overview, you will find the most important metrics that reflect how potential buyers interact with your listings. Here you can check your number of Pageviews, Listing Saves, Business Page Clicks, and Leads.
-
Pageviews - the number of times your listings were viewed.
-
Listing Saves - the number of times your listings were saved.
-
Business Page Clicks - the number of times the link to your Business Page was clicked.
-
Leads - the number of inquiries and calls you received.
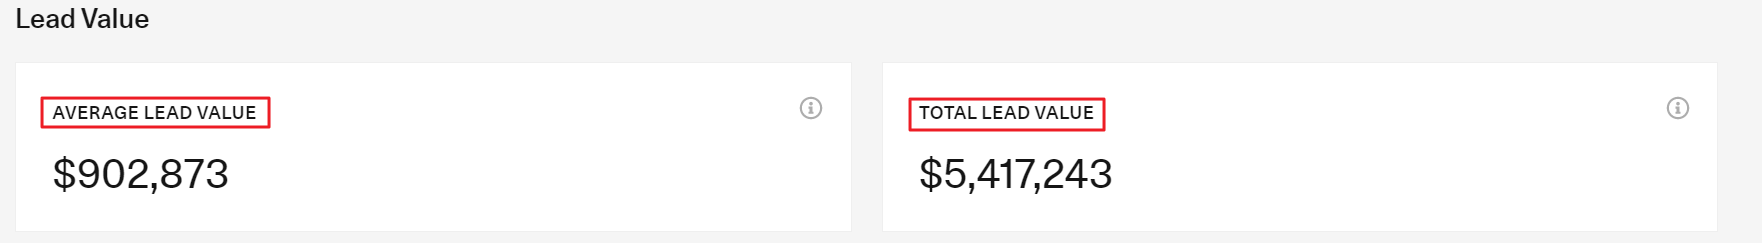
Lead Value
Here you can see your Average Lead Value and the Total Lead Value. JamesEdition is a luxury platform, and our leads are different. You may receive fewer leads here than you do on local portals, but the lead average and total value are much higher. Leads from JE are more valuable because they come from trusted and verified buyers. Due to the trustworthiness of the leads, they are worth 10 leads from a regular portal.
-
Average Lead Value - the average value of leads that you received during a selected period.
-
Total Lead Value - the total value of leads that you received during a selected period.
Note! Please take into account that the currency value will be displayed as the currency that you have selected in your settings. Please read this article on how to change the currency type, if the currency presently displayed is incorrect.
Detailed Metrics
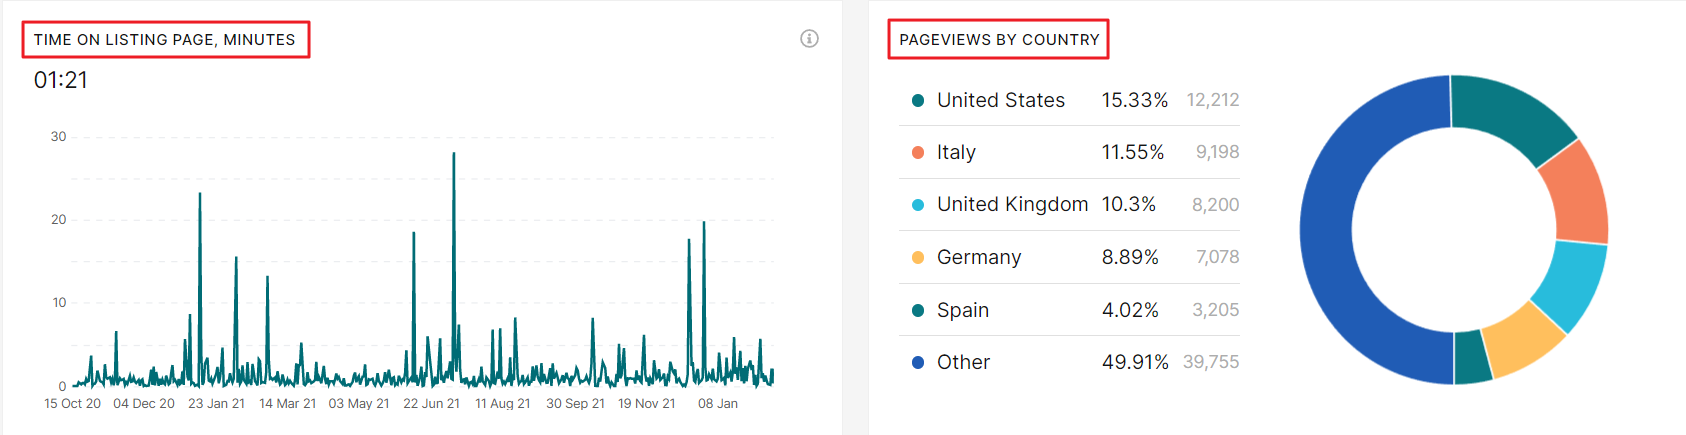
Here you can see the graphs for all of the metrics mentioned above, plus Time on Listing Page, Minutes (the average amount of time users spent viewing each of your listings), and Pageviews by Country (the number of times your listings were viewed in your top 5 countries).
-
Time on Listing Page - we focus on presentation and highlight the beautiful materials that our business users create. Consequently, listings are exceptionally engaging and prospective buyers spend a great deal of time viewing them.
-
Pageviews by Country - as we are a global portal, it's worth seeing which users from which countries your listings attract the most.
And here is the GIF illustrating how you can see the statistics of your listings.
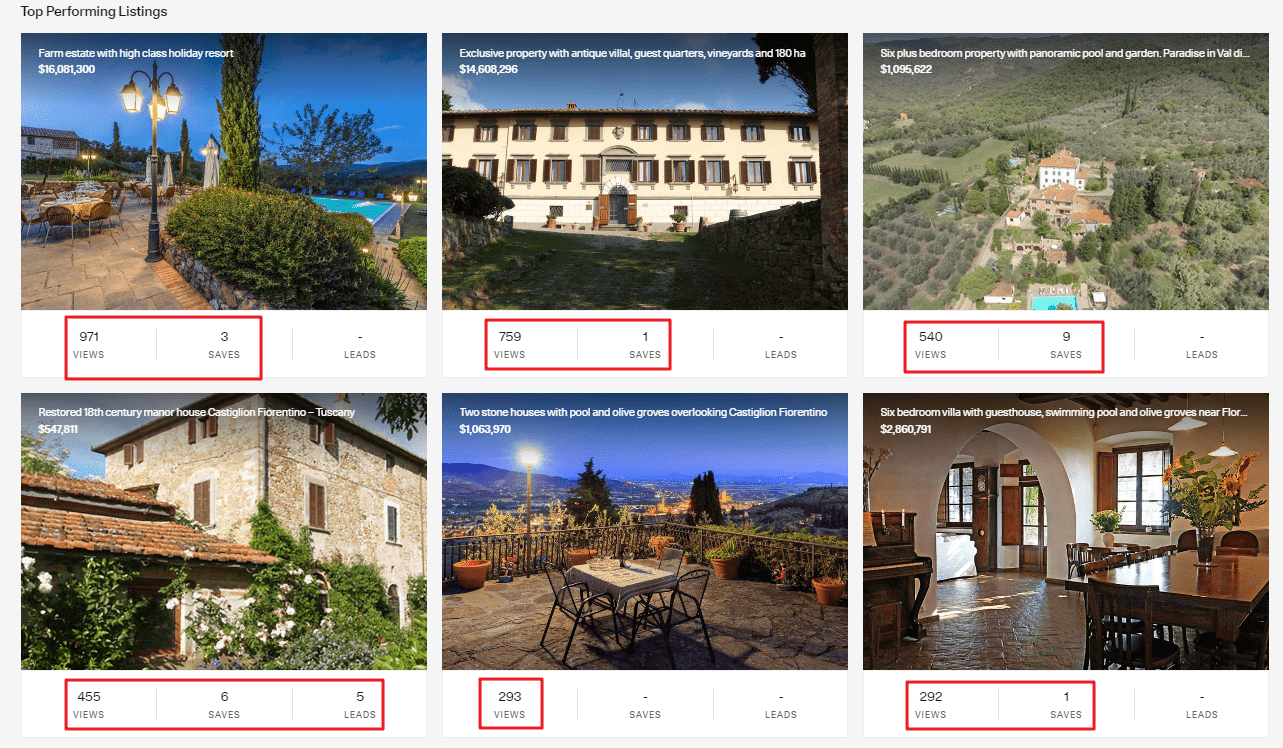
Top Performing Listings
Here you can see the listings that have brought you the largest number of views, saves, and leads.
If you have any questions please write us here, or book a meeting with us.
Did this answer your question?How do I see the statistics for one specific listing?
-
Сlick on the preferred listing. It will open in a popup window.
2. In the Statistics tab, you can see the performance of your listing exactly the same way as in the general statistics section but specific for the listing of your choice.
Check the period of the past 7, 30, or 90 days or even for all time aggregating data by day, week, or month. You can also export your report for this specific listing as a CSV file. that usually takes several minutes to load. Two views are available in the dashboard: Overview and Detailed Metrics just like the metrics that we have seen above.